Mark A. Wright, Ph.D.
Technical Portfolio
Automated Kinematic Correction (Euler-to-Quaternion)
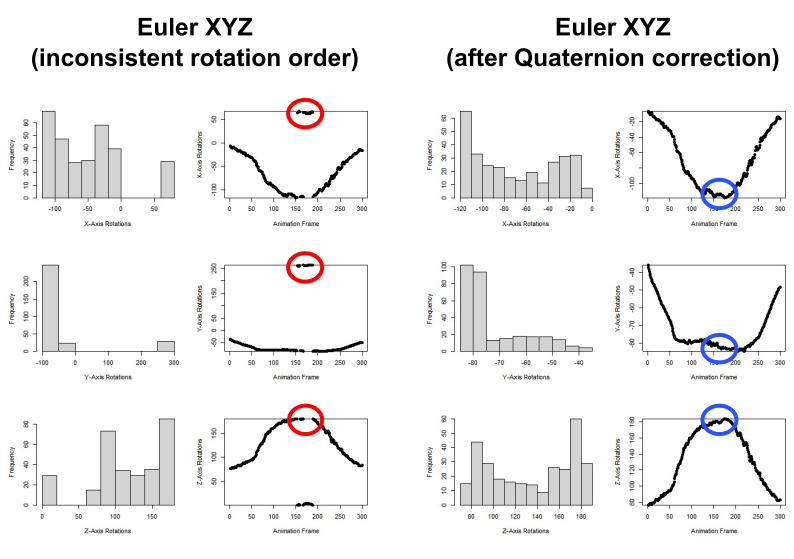
- Problem: Existing community-developed XROMM tools for animating mesh rigidbodies based on CT marker coordinates resulted in inconsistent Euler XYZ rotation order keyframe data.
- Solution: I engineered a custom R script leveraging 4D quaternion notation to mathematically resolve rotation order inconsistencies across 88k 6-DoF data points.
- Impact: This tool eliminated manual data cleaning steps while ensuring 100% kinematic accuracy for downstream analytical engines.
- Visual: "Before" and "After" sample of Euler XYZ coordinates (X: top, Y: middle, Z: bottom) across a ~300 keyframe segment of real data. See the full published work here.
3D Mesh Mass-Property Automation
- Problem: Manual mass-property estimation for non-standard anatomical specimens was slow and prone to human error.
- Solution: I developed a Python pipeline using Trimesh and NumPy to automate volumetric and center-of-mass calculations directly from 3D mesh data.
- Impact: This tool produced rapid, accurate mass estimates for anatomical segments, cutting data collection time by 90% and enabling immediate integration into predictive linear models.
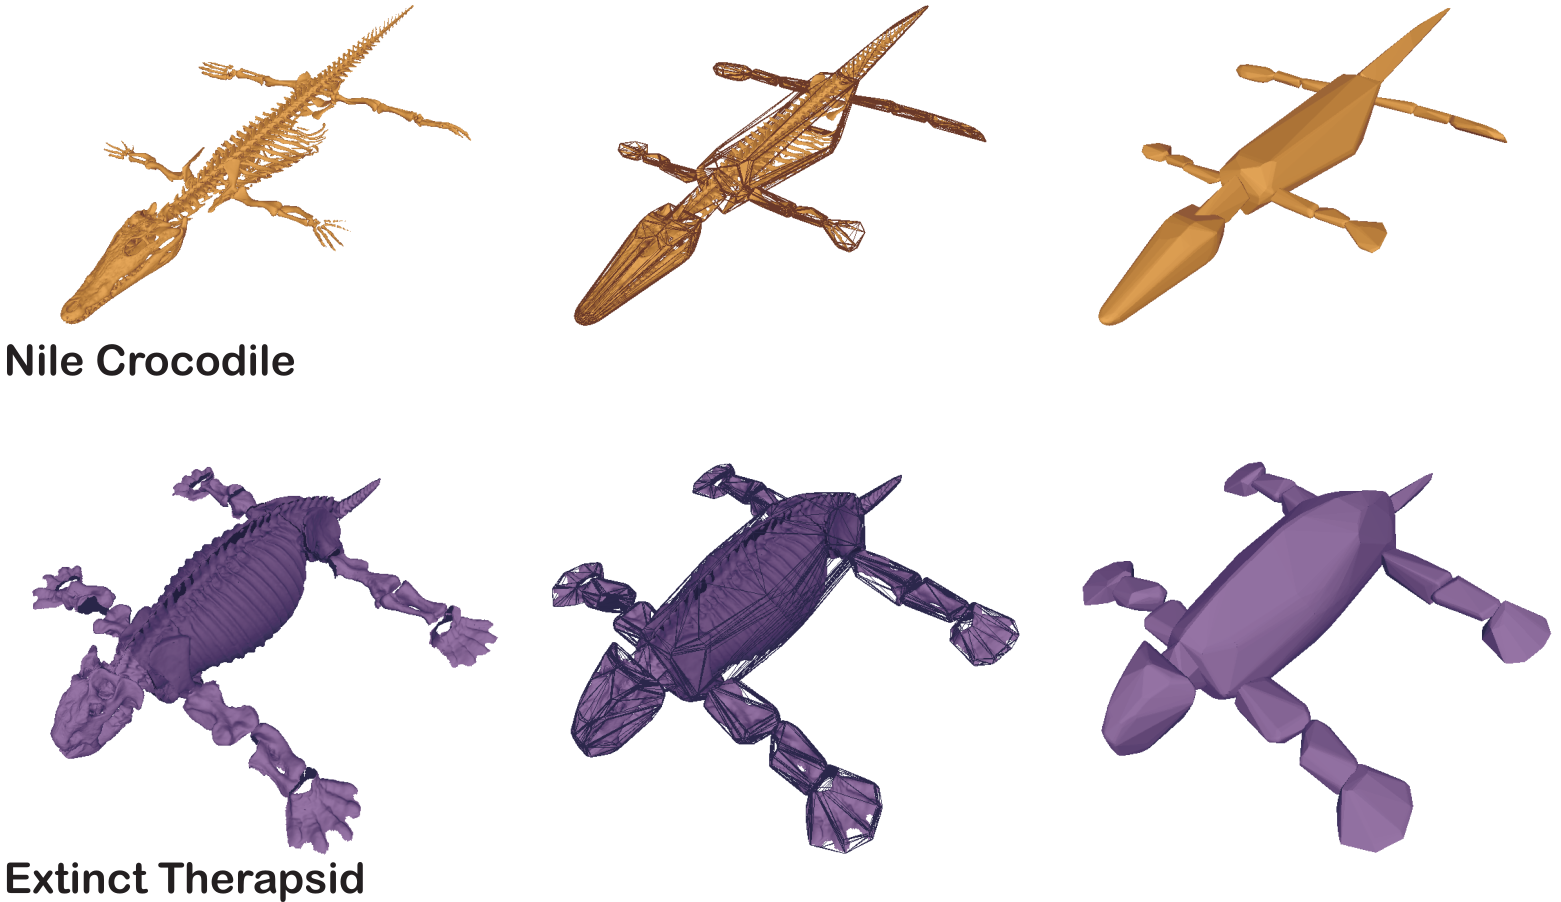
- Visual: Digitized models of a modern crocodile (top) and fossil therapsid (bottom) via CT scan and photogrammetry, respectively. Left-to-right demonstrates watertight wrappage of body segments into convex hulls prior for geometric mass-property estimation. See the full published work here.
High-Dimensional Shape Trajectories for Time Series
- Problem: Analyzing and comparing high-dimensional shape change trajectories across time series was a qualitative, non-standardized process.
- Solution: I engineered MorphoTraj, a specialized R-based toolkit designed to synthesize morphogenetic shape change trajectories for high-dimensional time series shape data.
- Impact: This analytical toolkit provided a standardized framework for comparing developmental (i.e., morphogenetic) shape change trajectories to macroevolutionary bone shape trends.
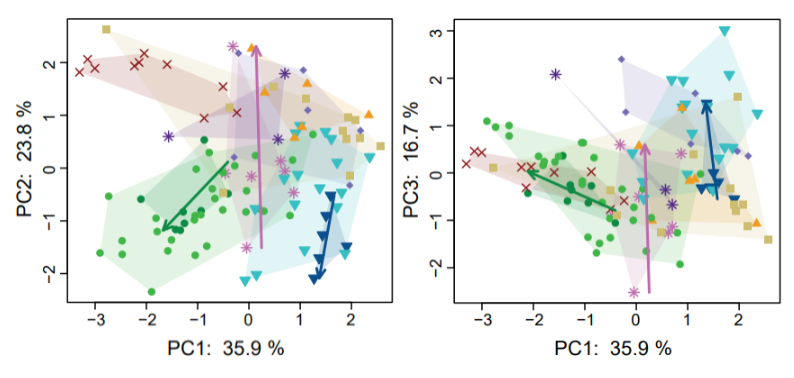
- Visual: Sample of anonymized dataset from unpublished work. Arrows represent multi-dimentional shape change trajectories for time series data, color-coded by taxonomic group.
Designed by me. All rights reserved. ©